Solve the problem.You brake your car from a speed of 65 mph. The table shows data that represent your car's speed versus the amount of time elapsed from the moment that you began to brake. Graph the data. For what interval of time is the speed increasing? For what interval of time is the speed decreasing? For what interval of time is the speed constant?
A. 
0 to 5 seconds; None; 5 to 6 seconds
B. 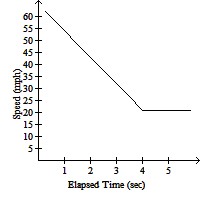
0 to 4 seconds; None; 4 to 6 seconds
C. 
None; 0 to 5 seconds; 5 to 6 seconds
D. 
None; 0 to 4 seconds; 4 to 6 seconds
Answer: D
You might also like to view...
Use Lagrange multipliers to find the maximum value of the function subject to the given constraint.
 multiple choice.png)
Write the number in standard form.It takes approximately 1.578 × 10⁻⁵ miles to equal one inch.
A. 0.0001578 B. 0.000001578 C. 157,800 D. 0.00001578
Find the equation of a line with the given slope and y-intercept.Slope 3, y-intercept (0, -4)
A. y = 3x - 4 B. y = -4x + 3 C. y = 4x + 3 D. y = 3x + 4
Solve the problem.A satellite dish is shaped like a paraboloid of revolution. The signals that emanate from a satellite strike the surface of the dish and are reflected to a single point, where the receiver is located. If the dish is 8 feet across at its opening and is 2 feet deep at its center, at what position should the receiver be placed?
What will be an ideal response?