Solve the problem.The graph below shows temperature T as a function of time t for a 6 hour period. Use the graph to approximate the average temperature for the day.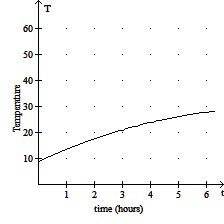
A. 30°
B. 15°
C. 20°
D. 25°
Answer: C
Mathematics
You might also like to view...
Find the area of the figure. Use 3.14 for ?.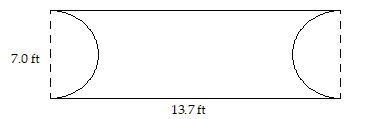
A. 76.6675 ft2 B. 38.39 ft2 C. 57.435 ft2 D. Not enough data
Mathematics
Graph the equation by plotting points.y = x3 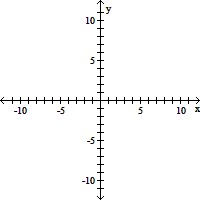
A. 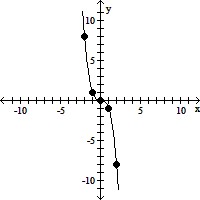
B. 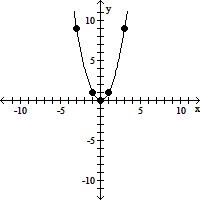
C. 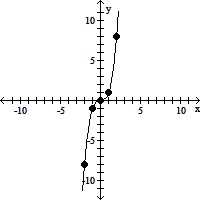
D. 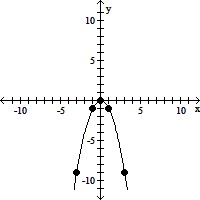
Mathematics
Graph the linear function. Give the domain and range.h(x) = 5x
A. Domain: (-?, ?)
Range: (-?, ?)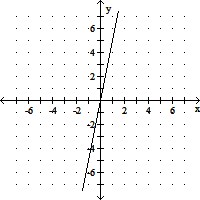
B. Domain: (-?, ?)
Range: (-?, ?)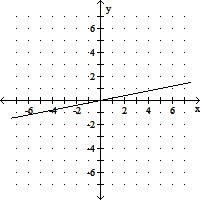
Mathematics
Write an equivalent expression. Use an associative law.r + (9 + s)
A. r(9 + s) B. (r + 9) + s C. (9 + s) + r D. r + (s + 9)
Mathematics