Solve the problem.The following data represents the normal monthly precipitation for a certain city. 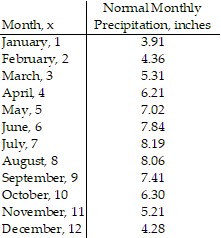 Draw a scatter diagram of the data for one period. Find the sinusoidal function of the form
 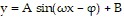 that fits the data. Draw the sinusoidal function on the scatter diagram. Use a graphing utility to find the sinusoidal function of best fit. Draw the sinusoidal function of best fit on the scatter diagram.
What will be an ideal response?
y = 2.17 sin(0.49x - 1.88) + 6.02;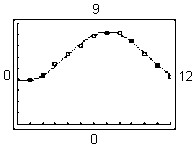
Mathematics
You might also like to view...
Find the square root. Do not use a calculator. Do not refer to a table of square roots.The area of a square is 49 in2. What is the length of each side?
A. 2401 in.
B. 49 in.
C.  in.
in.
D. 7 in.
Mathematics
Use a number line to find the sum.3 + (-4)
A. 7 B. -1 C. -7 D. 1
Mathematics
Solve the equation by factoring.25x2 - 50x - 11 = 0
A. 
B. 
C. 
D. 
Mathematics
Complete the factoring.9x2 + 56x + 12 = (x + 6)( )
A. x - 6 B. x + 2 C. 9x - 6 D. 9x + 2
Mathematics