The following double-bar graph illustrates the revenue for a company for the four quarters of the year for two different years. Use the graph to answer the question. 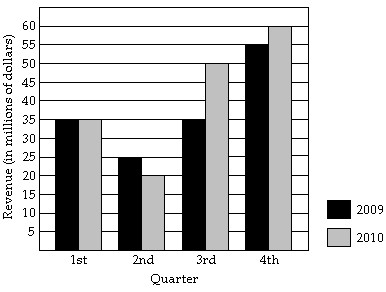 How much more revenue did the company take in for the fourth quarter of 2010 than the third quarter of 2010?
A. $5 million
B. $10 million
C. $1 million
D. $2 million
Answer: B
Mathematics
You might also like to view...
Find the limit. sec x
sec x
A. 0 B. -? C. 1 D. ?
Mathematics
Find the exact value of the expression.sin
A. 
B. 
C. 
D. 
Mathematics
Solve the problem.Let y1 equal the left side and let y2 equal the ride side of the given equation. Graph y1 and y2 and use the graph to solve the equation x - 3 = -2.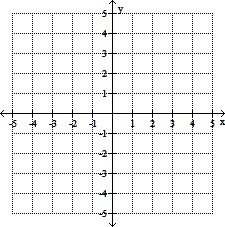
A. 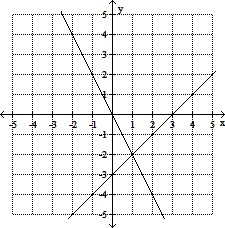
x = 1
B. 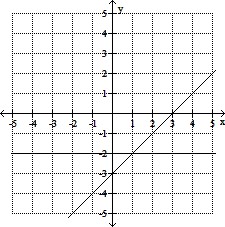
x = 1
C. 
x = 5
D. 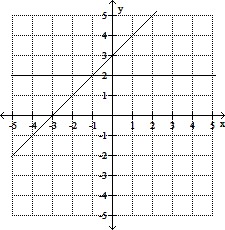
x = -1
Mathematics
Find all rational zeros of f. Then (if necessary) use the depressed equation to find all roots of the equation f(x) = 0.f(x) = 3x3 - 19x2 + 27x - 7
A. 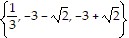
B. 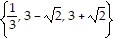
C. 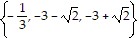
D. 
Mathematics