Use the line graph to answer the question.The line graph shows the 2001 sales data for the Big "D" company. 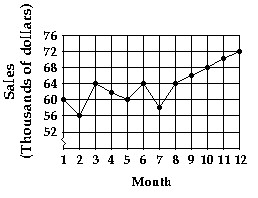 What were the total sales for the first 6 months?
A. $302,000
B. $364,000
C. $424,000
D. $366,000
Answer: D
Mathematics
You might also like to view...
Graph the ellipse. Label the intercepts.4x2 + y2 - 100 = 0
A. (-10, 0), (10, 0), (0, -5), (0, 5)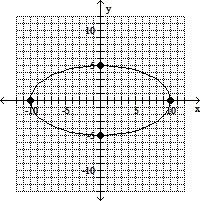
B. (-5, 0), (5, 0), (0, -2), (0, 2)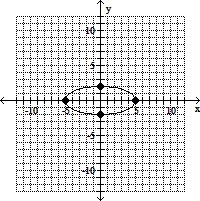
C. (-5, 0), (5, 0), (0, -10), (0, 10)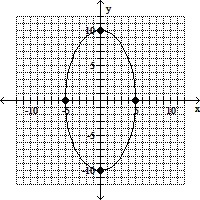
D. (-2, 0), (2, 0), (0, -5), (0, 5)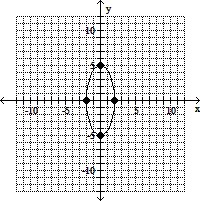
Mathematics
Use the graph to determine the domain and range of the function.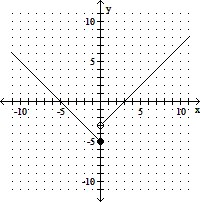
A. Domain: (-?, 0) ? (0, ?);; range: (-5, ?) B. Domain: (-?, ?); range: [-5, ?) C. Domain: (-?, ?); range: (-?, -5] D. Domain: (-?, ?); range: (-3, ?)
Mathematics
Use the Change-of-Base Formula and a calculator to evaluate the logarithm. Round your answer to two decimal places.log 203.2
203.2
A. 5.93 B. 0.39 C. 0.17 D. 2.97
Mathematics
Convert the radian measure to degrees.
A. 22.5° B. 45° C. 32.5° D. 90°
Mathematics