Refer to the following graph.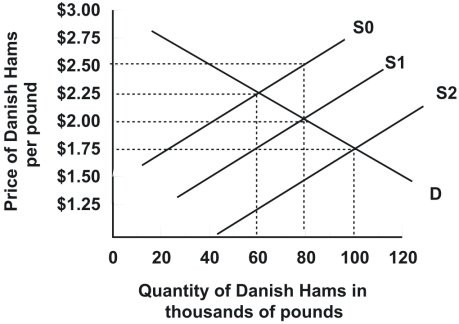 Demand and supply are initially D and S1, respectively. Which of the following best describes the effect of a $0.50 per pound tariff on Danish hams imported into the United States?
A. Supply shifts from S1 to S0; quantity sold declines to 60 thousand pounds and price paid by consumers rises to $2.25 a pound
B. Neither supply nor demand shift, but price paid by consumers declines to $1.50 a pound while quantity sold remains at 80 thousand pounds
C. Supply shifts from S1 to S2; quantity sold rises to 100 thousand pounds and price paid by consumers declines to $1.75 a pound
D. Supply shifts from S1 to S0; quantity sold declines to 60 thousand pounds and price paid by consumers rises to $2.50 a pound
Answer: A
You might also like to view...
Refer to the table below. If these are the only three price options for a bushel of corn, what is the value of A?
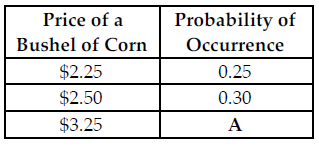
The above table provides the possible prices for a bushel of corn next year along with the associated probabilities (in percent).
A) 0.55
B) 0.45
C) 0.25
D) 0.30
An increase in unemployment will cause this year's production possibilities curve to shift inward toward the origin
Indicate whether the statement is true or false
Identify the correct mathematical relationship between the marginal propensity to consume (MPC) and the marginal propensity to save (MPS)
a. MPC + MPS = 1 b. MPC – MPS = 1 c. MPC × MPS = 1 d. MPS + MPC = 0
In a perfectly competitive resource market the Marginal Revenue Product Curve is
A) vertical. B) horizontal. C) downward sloping. D) upward sloping.