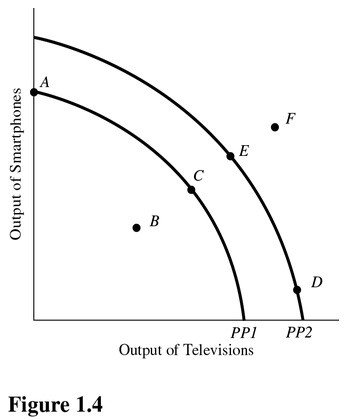
 In Figure 1.4, a shift of the production possibilities curve from PP1 to PP2 could be caused by
A. Implementation of training programs that improve the skills of workers.
B. A flu epidemic that makes many workers sick.
C. Tougher pollution controls for the producers of televisions and smartphones.
D. An increase in the unemployment rate.
Answer: A
You might also like to view...
A government decision to privatize a sector of the economy formerly operated by the government is an example of ________ policy.
A. aggregation B. structural C. fiscal D. monetary
You observe that in the market for coffee that both the equilibrium price of coffee and the equilibrium quantity have increased. You predict that the demand for coffee
A) has increased with no change in the supply of coffee. B) has increased but it is not as large as the increase in supply. C) has not changed but that the supply of coffee has decreased. D) has increased less than supply of coffee has decreased.
A portion of the balance of payments in which remaining outstanding claims are financed is known as the
a. current account. b. settlement account. c. capital account. d. balance of trade.
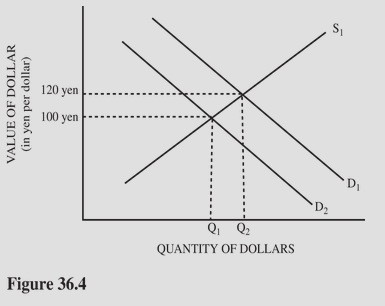 Refer to Figure 36.4 for the dollar-yen foreign exchange market. A decrease in demand from D1 to D2 could have been caused by
A. A poor performance by the Japanese stock market compared to the U.S. stock market. B. A quota placed on Japanese television imports to the United States. C. A decrease in the demand for U.S. computers. D. An increase in the number of Japanese visitors to the United States.