Use the following graph which shows the monthly sales of a heating supplier.  What was the percent of increase in sales from March to April?
A. 10.2%
B. 102.4%
C. 50.6%
D. 127%
Answer: B
Mathematics
You might also like to view...
Find an equation for the graph.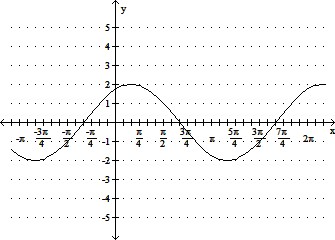
A. y = -2 cos 
B. y = 2 cos 
C. y = 2 sin 
D. y = -2 sin 
Mathematics
Perform the indicated operation. Simplify your answers.  +
+ 
A. 
B. 
C. 
D. 
Mathematics
Find the LCM of the set of numbers.24, 18, 28
A. 672 B. 252 C. 504 D. 168
Mathematics
Provide an appropriate response.Find the standard deviation for the following data set:2, 2, 2, 5, 5, 6, 6, 8, 8, 9
A. 6.21 B. 2 C. 2.49 D. 5
Mathematics