Use the following given market-for-money diagrams to answer the next question.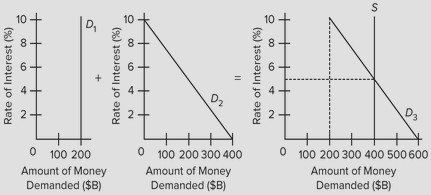 Curve D1 represents the
A. transactions demand for money.
B. asset demand for money.
C. total demand for money.
D. stock of money.
Answer: A
You might also like to view...
During the 1970s in the U.S. ________
A) the inflation rate peaked at over 14% B) oil prices quadrupled C) the unemployment rate rose above 8% D) all of the above E) none of the above
Which of the following statements is true?
a. The inclusion of intermediate goods and services into GDP calculations would underestimate our nation's production level. b. The expenditures approach sums the compensation of employees, rents, profits, net interest, and nonincome expenses for depreciation and indirect business taxes. c. Real GDP has been adjusted for changes in the general level of prices due to inflation. d. Real GDP equals nominal GDP multiplied by the GDP deflator.
Which of the following is not true about a profit-maximizing monopolist?
a. The monopolist faces the downward-sloping market demand curve. b. The monopolist always earns an economic profit. c. The price of output exceeds marginal revenue. d. The monopolist chooses output where marginal revenue equals marginal cost. e. All of these are true.
Most individual's income peaks when they are about
A) 25. B) 40. C) 50. D) 65.