A point on the supply curve can illustrate the
A) price and the corresponding quantity supplied.
B) marginal cost of that unit of the good.
C) price the consumer is willing to pay.
D) Both answers A and B are correct.
E) Both answers A and C are correct.
D
You might also like to view...
In the long run, an increase in aggregate demand: a. increases the price level and real output, but the effect on the price level is larger. b. increases the price level and real output, but the effect on output is larger
c. affects only real output. d. affects only the price level. e. affects neither the price level nor real output.
The real wealth effect is one reason for the negative slope of the aggregate demand curve
a. True b. False Indicate whether the statement is true or false
In the open economy of Sildavia, government spending during 2005 was $30 billion, consumption was $70 billion, taxes were $20 billion, and GDP was $100 billion. If investment spending in Sildavia during 2005 was $10 billion, we can conclude that Sildavia registered:
A. a net capital inflow of $10 billion. B. capital inflows of $10 billion and capital outflows of $20 billion. C. a trade surplus of $20 billion and a financial deficit of $20 billion. D. a net capital outflow of $10 billion.
Refer to the information provided in Figure 7.10 below to answer the question(s) that follow. 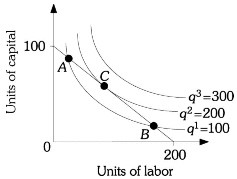 Figure 7.10Refer to Figure 7.10. At Point C, the slope of q2 = 200 is
A. -2. B. -1/2. C. -1. D. indeterminate from this information.