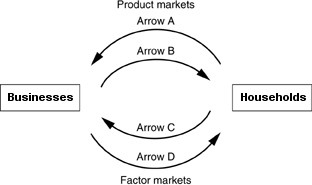
 Refer to the above figure. The top two arrows of the figure refer to the product markets. The bottom arrows refer to the factor markets. Which arrow represents total income?
A. Arrow A
B. Arrow B
C. Arrow C
D. Arrow D
Answer: D
You might also like to view...
If the domestic producers of a good benefit from free trade, it suggests that the country:
A. is a net importer of that good. B. does not have an absolute advantage in that good. C. does not have a comparative advantage in that good. D. is a net exporter of that good.
Consider the following data for a closed economy:
a. Y = $12 trillion b. C = $8 trillion c. I = $3 trillion d. TR = $2 trillion e. T = $3 trillion Use the data provided to calculate the level of private saving and the level of public saving and demonstrate their relationship to investment.
Consider a downward-sloping demand curve. When the price of a normal good decreases, the income and substitution effects
A) work in the same direction to increase quantity demanded. B) work in the same direction to decrease quantity demanded. C) work in opposite directions and quantity demanded increases. D) work in opposite directions and quantity demanded decreases.
Refer to Figure 9.1. If the government establishes a price ceiling of $20, the resulting deadweight loss will be
A) $0. B) $20. C) $30. D) $300. E) $600.