A graph showing all the combinations of capital and labor available for a given total cost is the
A. isocost line.
B. budget constraint.
C. expenditure set.
D. isoquant.
Answer: A
You might also like to view...
The Denver Broncos is a football team in the NFL, the Colorado Crush was an arena football team, and the Highlands Ranch Falcons is a local High School team
Broncos tickets cost about $415, Crush tickets cost between $30 and $85 and Falcons tickets are $6. What does marginal utility theory predict about the marginal utility per dollar from each of these football games? A) The marginal utility per dollar will be greatest for the Broncos. B) The marginal utility per dollar will be equal for all games. C) The marginal utility per dollar will be greatest for the Crush. D) The marginal utility per dollar will be greatest for the Falcons.
What is the marginal product of labor and what is the average product of labor
What will be an ideal response?
After a price ceiling of $8 is placed on the market in the graph shown:
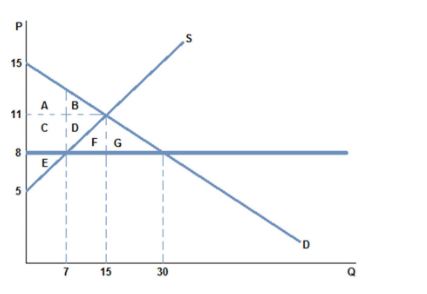
A. some consumers benefit because they pay a lower price.
B. producers lose because they sell at a lower price.
C. the quantity traded in the market falls.
D. All of these are true.
Contestable markets improve the performance of imperfect markets with
A. government regulations. B. the threat of entry. C. advertising. D. tacit collusion.