Draw a picture to illustrate why total surplus is highest at the competitive equilibrium price and not at a price below equilibrium. Explain your diagram.
What will be an ideal response?
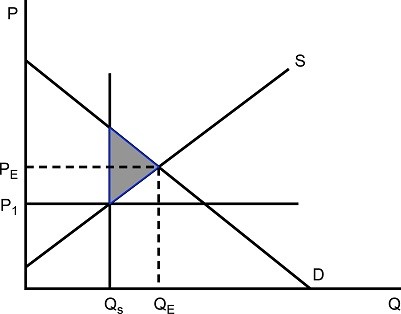
At a price (P1) below equilibrium (PE), producers are willing to supply a quantity (Qs) which is lower than the equilibrium (Qe)equilibrium. This means that some mutually beneficial trades do not take place. Total surplus is decreased by the amount illustrated by the shaded triangle.
You might also like to view...
If planned investment changes as interest rates change, then
A) autonomous consumption changes. B) autonomous investment changes. C) total expenditures and output changes. D) the marginal leakage rate changes.
If you are following a tit-for-tat strategy in a repeated game, and your opponent makes a cooperative move, you will:
A. collude. B. make a cooperative move in the next round. C. price compete. D. defect.
It is important for a business owner to understand the market structure in which they operate because:
A. it can help in deciding whether to advertise. B. it will tell how much attention to pay to competitors' behavior. C. it defines how much freedom they have to set prices. D. All of these statements are true.
There has been a decrease in the demand for socks. This change can be shown graphically as a:
A. shift in the demand curve to the left. B. shift in the demand curve to the right. C. movement along the demand curve to the right. D. movement along the demand curve to the left.