Solve the problem.The graph below shows the total sales of houses in a town from 2000 to 2005. The graph also shows the sale of houses in the summer , S, and in the other times of the year, Y.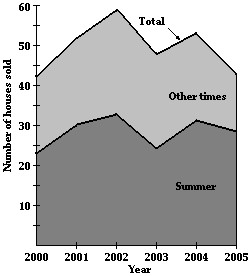 Estimate Y(2004)
A. 26
B. 17
C. 41
D. 21
Answer: D
Mathematics
You might also like to view...
Answer the question.What does the digit 4 mean in the number 247,189?
A. 4 hundreds B. 4 ten thousands C. 4 thousands D. 4 hundred thousands
Mathematics
Add or subtract as indicated. Simplify, if necessary. -
- 
A. 
B. 3
C. 
D. 
Mathematics
Find the value of x that satisfies the equation.x + 1 = 2
= 2
A. x = 
B. x = 3
C. x = 2
D. x = 
Mathematics
Evaluate the iterated integral.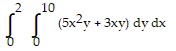
A. 
B. 
C. 
D. 
Mathematics