Use the following supply and demand graph to answer the question below. 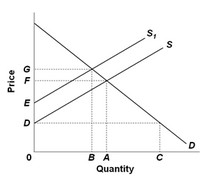 In the graph, line S is the current supply of this product, while line S1 is the optimal supply from the society's perspective. This figure suggests that there is (are)
A. external costs from the production of this product.
B. external benefits from the production of this product.
C. positive externalities from producing the good.
D. currently an underallocation of resources toward producing this good.
Answer: A
You might also like to view...
Which of the following is a source of income inequality?
a. differences in ability b. differences in work intensity c. risk taking d. all of the above
An unexpected sharp reduction in inflation will most likely result in
a. the rapid growth of output and employment. b. a reduction in the actual rate of unemployment. c. a reduction in the natural rate of unemployment. d. a temporary increase in unemployment and a decline in real output.
The study of aggregate economic activity for the economy as a whole is
A. Opportunity cost. B. Scarcity. C. Microeconomics. D. Macroeconomics.
In 2014, exports as a percentage of GDP for the United States are approximately
A) between 1% and 5%. B) between 10% and 20%. C) between 20% and 40%. D) between 40% and 75%. E) between 75% and 90%.