Refer to the graph. A decrease in fixed costs is shown by:
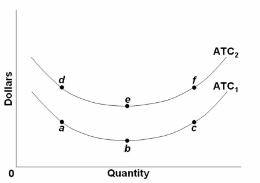
A. a move along short-run average total cost curve ATC 2 from point e to point f.
B. a move along short-run average total cost curve ATC 1 from point a to point b.
C. the shift of the short-run average total cost curve from ATC 1 to ATC 2 .
D. the shift of the short-run average total cost curve from ATC 2 to ATC 1
D. the shift of the short-run average total cost curve from ATC 2 to ATC 1
You might also like to view...
Suppose when Nablom's Bakery raised the price of its breads by 10 percent, the quantity demanded fell by 15 percent. What was the effect on sales revenue?
A) Sales revenue increased. B) Sales revenue decreased. C) Sales revenue remained unchanged. D) It cannot be determined without information on prices.
Suppose the nominal interest rate is 5 percent, the tax rate on interest income is 30 percent, and the after-tax real interest rate is 2.1percent. Then the inflation rate is 2 percent
a. True b. False Indicate whether the statement is true or false
If an exclusive union is successful in restricting the supply of labor, the:
A. wage rate will rise. B. quantity of labor demanded will rise. C. number of job opportunities in the firm or industry will increase. D. demand for labor curve will shift leftward.
If the measured unemployment rate is 6% and the natural unemployment rate is 4%, then
A. cyclical unemployment is 2%. B. frictional unemployment is -2%. C. structural unemployment is 10%. D. frictional unemployment is 2%.