The amounts A (in billions of dollars) donated to support higher education in the United States from 2000 through 2007 are shown in the table, where t represents the year, with t = 0 corresponding to 2000.
Year, tAmount, A0
23.3
1
24.3
2
24
3
24
4
24.5
5
25.7
6
28.1
7
29.9
Use a graphing utility to select a correct a scatter plot of the above data.
A. ?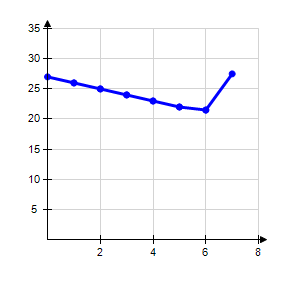
B. ?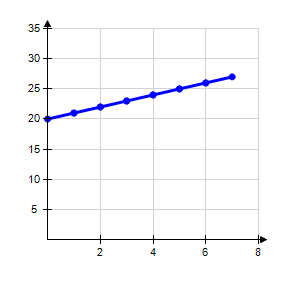
C. ?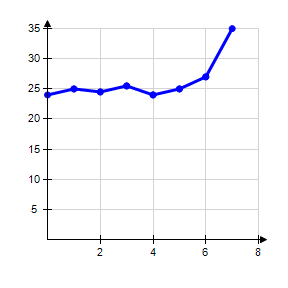
D. 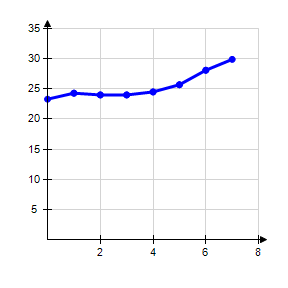
E. ?
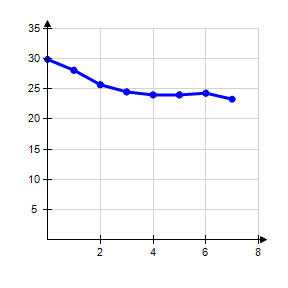
Answer: D
Mathematics
You might also like to view...
Write as a sum or difference of logarithms. Your results should not contain any exponents or radicals.log 10 xy
A. log 5 x + log 5 y B. log 10 x - log 10 y C. log 5 x - log 5 y D. log 10 x + log 10 y
Mathematics
Provide an appropriate response.Monthly payments are the fastest way to pay off a home mortgage.
A. True B. False
Mathematics
Graph the parabola.x = -5(y + 4)2 - 4 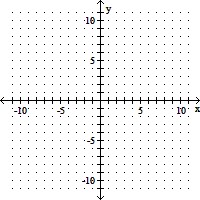
A. 
B. 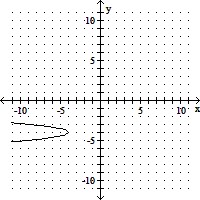
C. 
D. 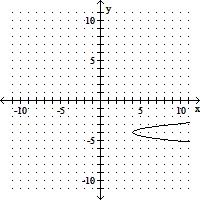
Mathematics
Find two square roots for the complex number. Write your answer in standard form.
?
 ?
?
A. 
B. 
C. 
D. 
E. 
Mathematics