Refer to the Laffer Curve above. An increase in the tax rate from T2 to T3 would:
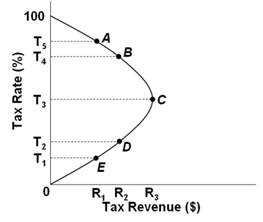
A. Decrease tax revenues and support the views of supply-side economists
B. Increase tax revenues and support the views of supply-side economists
C. Increase tax revenues and support the views of mainstream economists
D. Decrease tax revenues and support the views of mainstream economists
C. Increase tax revenues and support the views of mainstream economists
You might also like to view...
In the case of a specific tax, tax incidence is independent of who pays
A) only when supply and demand elasticities are not constant. B) only when the tax is collected from consumers. C) in most but not all cases. D) in all cases.
Refer to the accompanying figure.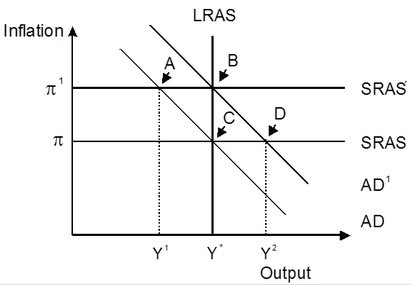 An economy in short-run equilibrium at point A has a(n) ________ gap. The gap could be eliminated by the self-correcting mechanism of the economy and eventually achieve long-run equilibrium at point ________ or the central bank could intervene with monetary easing establishing the long-run equilibrium at point ________.
A. recessionary; C; B B. expansionary; C; B C. expansionary; B; C D. recessionary; B; C
If the U.S. government decides to eliminate a budget surplus by reducing taxes, the most likely effect would be
A. falling prices. B. a reduction in the trade deficit. C. an increase in unemployment. D. upward pressure on prices.
Federal government expenditures as a percentage of GDP
A) have risen since the early 1950s to the present. B) have fallen since the early 1950s to the present. C) rose from 1950 to 1991, fell from 1992 to 2001, rose again until 2011, and have fallen from 2011 to the present. D) rose from 1950 to 2001 and then fell from 2001 to the present. E) rose from 1950 to 1980, fell from 1981 to 2001, and have risen from 2001 to the present.