The accompanying figure shows the production possibilities curve for the island of Genovia: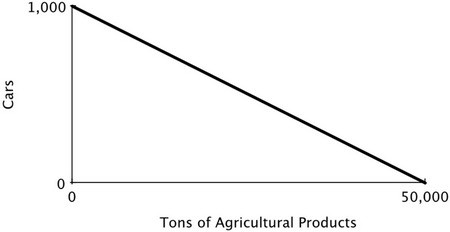 The opportunity cost of producing one ton of agricultural products in Genovia is:
A. 1/50 of a car.
B. 1/5 of a car.
C. 1 car.
D. 1,000 cars.
Answer: A
You might also like to view...
The above figures show the market for hamburger meat. Which figure shows the effect when more farmers decide to raise cows that are processed into hamburger meat?
A) Figure A B) Figure B C) Figure C D) Figure D
Suppose an economy has the following characteristics: 100 people in the noninstitutional population; 60 people employed; 20 people not in the labor force. What's the unemployment rate?
A) 20 percent B) 25 percent C) 33 percent D) 40 percent E) 60 percent
If four workers can produce 18 chairs a day and five can produce 20 chairs a day, the marginal product of the fifth worker is
A) 2 chairs. B) 3 chairs. C) 4 chairs. D) 38 chairs.
Refer to above figure. If OmL1 workers are employed in manufacturing then what is the marginal productivity of labor in manufacturing?
What will be an ideal response?