The following diagram shows the rate of inflation each year during a five-year span. Use this diagram to answer the next question.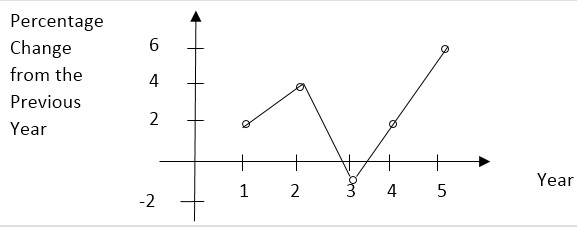 In which year are people on fixed incomes hurt the most?
A. Year 2
B. Year 3
C. Year 4
D. Year 5
Answer: D
You might also like to view...
Which of the following statements is NOT true about Say's law?
A) Markets would be regularly hit by severe shortages and surpluses. B) People produce more goods than they want for their own use only if they seek to trade them for other goods. C) Desired expenditures will equal actual expenditures. D) Surpluses will be eliminated by falling prices and shortages will be eliminated by increasing prices.
The rule of 70 states that
A) the number of years it takes an economy to double in size is the growth rate times 70. B) the number of years it takes an economy to double in size is the growth rate divided by 70. C) it takes an economy 70 years to double its real GDP. D) the number of years it takes an economy to double in size is 70 divided by the growth rate.
In the real world:
A. businesses can easily identify different groups' willingness to pay, so price discrimination is prevalent in every market. B. price discrimination is practiced less today than it was in the mid-1900s. C. perfect price discrimination is impossible. D. price discrimination has only been observed where monopolies are present.
Which legal claim has a fixed annual coupon payment?
A) common stock B) preferred stock C) bond D) reinvestment