Describe the distributions with a pie chart.The following figures give the economic distribution for 5,000 people who live in a certain county.PoorMiddle IncomeRich1,500?3,000?500
A. 
B. 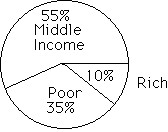
Answer: A
Mathematics
You might also like to view...
Use implicit differentiation to find dy/dx and d2y/dx2.x2 + y2 = 7
A.  = -
= -  ;
;  = -
= - 
B.  =
=  ;
;  =
= 
C.  = -
= -  ;
;  = -
= - 
D.  = -
= -  ;
;  = -
= - 
Mathematics
Use the graph to answer the question.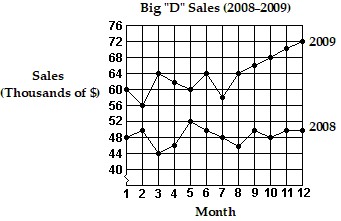 What was the difference between the highest and lowest monthly sales in 2008?
A. $8000 B. $2000 C. $6000 D. $4000
Mathematics
Solve the problem.A pilot wants to fly on a bearing of N 69.9° E. By flying due east, he finds that a 59-mph wind, blowing from the south, puts him on course. Find the ground speed of the plane.
A. 258 mph B. 172 mph C. 63 mph D. 343 mph
Mathematics
Use the figure to decide which of 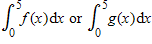 is larger, or if they are equal.
?
is larger, or if they are equal.
?

A. 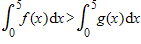
B. 
C. 
Mathematics