Refer to the information provided in Figure 3.10 below to answer the following question(s).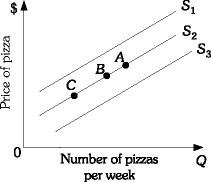 Figure 3.10Refer to Figure 3.10. A movement from Point C to Point B on supply curve S2 would be caused by a(n)
A. increase in the demand for pizza.
B. increase in the price of hamburgers, assuming hamburgers are a substitute for pizza.
C. decrease in the price of pizza dough.
D. decrease in the price of pizza.
Answer: A
You might also like to view...
Refer to Table 9-11. If the actual terms of trade are 1 hat for 1.8 clocks and 150 hats are traded, how many clocks will Belize consume?
A) 150 B) 270 C) 930 D) 1,200
Which of the following are examples of goods that have been subject to voluntary export restraints?
A) Japanese cars and Chinese solar panels B) Belgian chocolates and French wines C) French wines and cheeses D) Japanese sushi and German cars E) Taiwanese electronics and Canadian barley
The demand for computers increases. As a result
A) the quantity demanded of workers increases, the wage rate rises, and the supply of labor increases. B) the demand for workers increases, hiring increases, but wages stay the same since each firm faces a horizontal supply curve of labor. C) the wage rate increases in the industry and the quantity demanded of workers falls. D) the wage rate increases in the industry and the quantity supplied of workers increases.
High Powered Incentives Hyperion Tool & Dye bids for contracts to retool other companies' production lines. The compensation schedule for their sales staff includes a 2% commission for the first $350,000 in orders per quarter, 3% for the next $650,000,
and 4% for amounts over $1,000,000 . Hyperion is having trouble scheduling its staff for the jobs that they are awarded because the orders always seem to be awarded around the first and last days of a quarter. Why are orders bunched like this and how can Hyperion fix this?