The demand and supply curves in the market for gasoline are illustrated in the graph below.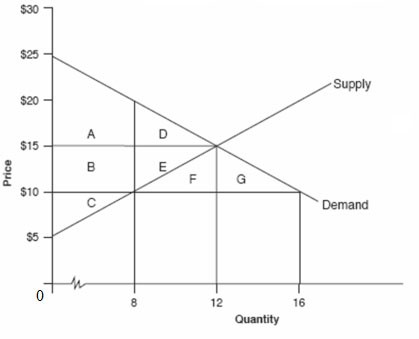 Starting at the equilibrium point, if the government imposes a price ceiling of $10, the deadweight loss will be the area ________.
A. F + G
B. D
C. E
D. D + E
Answer: D
You might also like to view...
Boyd Manufacturing operates in a perfectly competitive market. The firm recently purchased a new structure with an expected rate of return of 18 percent
If the market rate of interest is 10 percent, was the firm's decision to purchase the structure a wise one? Explain.
Which of the following terms describes how a good is produced in stages?
a. supply chain b. value chain c. supply trade d. value trade
Average fixed cost
A. decreases steadily as output increases. B. increases steadily as output increases. C. exhibits diminishing returns. D. is a horizontal line.
The basic idea behind a negative income tax is to
A. help local government agencies deliver more services to the poor. B. increase the in-kind income of the poor. C. help the poor get job skills. D. help the poor without destroying incentives to work.