The bar graph below represents various colors of cars sold. Use the graph to answer the question(s).  Estimate how many more white cars were sold than tan cars.
A. 22,000
B. 17,000
C. 7,000
D. 27,000
Answer: B
You might also like to view...
Find the ratio of net income after taxes to average owner's equity. Round to the nearest tenth of a percent.Owner's equity at beginning of year: $542,000. Owner's equity at end of year: $707,000. Net income after taxes: $90,500.
A. 16.8% B. 12.8% C. 14.5% D. 16.7%
Find the axis of symmetry of the quadratic function.f(x) = (x + 8)2 - 5
A. x = 5 B. x = 8 C. x = -8 D. x = -5
Graph the function by starting with the graph of the basic function and then using the techniques of shifting, compressing, stretching, and/or reflecting.f(x) = -x3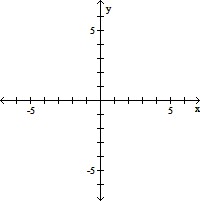
A. 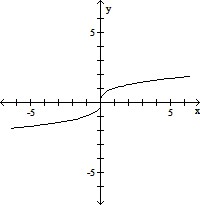
B. 
C. 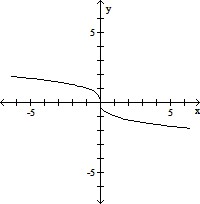
D. 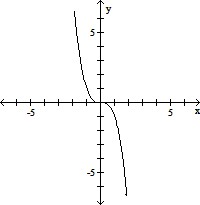
Solve the equation. Express irrational answers in exact form and as a decimal rounded to 3 decimal places.ln x + ln (x + 4) = -5
A.  ? -4.002
B.  ? 0.002
C. -4 +  ? 0.003
D.  ? 2.001