Exhibit 5-4 Gross domestic product data
National income accountBillions ofdollars
Depreciation$ 800
Net interest1,500
Compensation of employees4,000
Profits1,000
Rental income 100
Indirect business taxes 600
Consumer purchases1,000
As shown in Exhibit 5-4, national income (NI) is:
A. $6,000 billion.
B. $6,600 billion.
C. $7,200 billion.
D. $8,000 billion.
Answer: C
You might also like to view...
Today, the United States charges an average tariff rate
A) which is greater than any other high-income country. B) that is more than its average tariff rate in 1930. C) of less than 1.5 percent. D) that exceeds 50 percent.
What are the assumptions of the kinked demand curve model? What is its main conclusion about oligopoly behavior?
Which of the following is defined as a rate of downward movement in the price level for an aggregate of goods and services?
A. Price index B. Reinflation C. Deflation D. Inflation

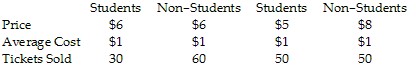
 Table 7.2 contains price, demand, and cost data for the Capri Theater, the only first-run movie theater in a small town. What is its profit from students under the student discount policy?
A. $200 B. $250 C. $325 D. $375