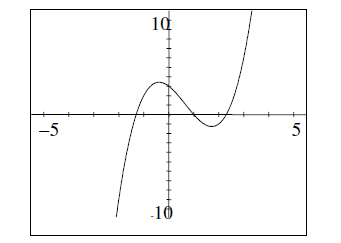
Use your grapher to graph: f (x) = x3 ? 2x3 ? 2x + 3.
Then sketch the graph below.
f (x) = x3 ? 2x3 ? 2x ?3.
You might also like to view...
Use cubic regression to model the following data. Round your answers to two decimal places, if necessary. x 1.32 2.17 3.11 4.68 5.27 6.71 7.33 8.65 y 1.24 3.75 4.16 2.73 2.49 3.74 4.06 6.98?
A. 
B. 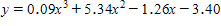
C. ?
D. ?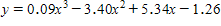
Let the function src="https://sciemce.com/media/3/ppg__cognero__2.1_Functions_and_Function_Notation__media__4ecf5ad6-54db-4941-8da3-9868d94f1c19.PNG" class="wirisformula" align="middle" style="vertical-align: middle;" data-wiris-created="true" varid="variable_id_field" variablename="impvar_81629ed29e6c4c72ac8f93132" />. be defined by
  , where x and
  are real numbers. Find
?

What will be an ideal response?
Use the graph to find the horizontal asymptote, if any, of the function.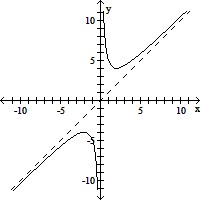
A. y = -4 B. none C. y = 4 D. y = 0
Draw a complete graph so that it has the given type of symmetry.Symmetric with respect to the y-axis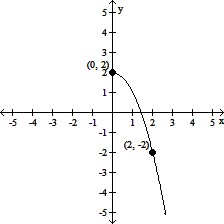
A. 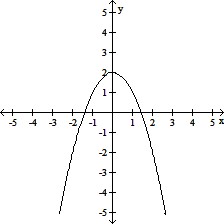
B. 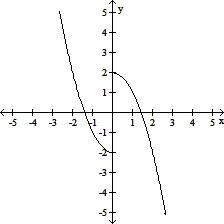
C. 
D. 