Graph the function.y = sec 2x
A. 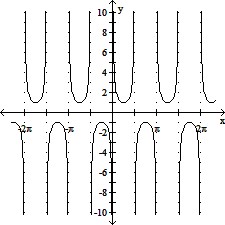
B. 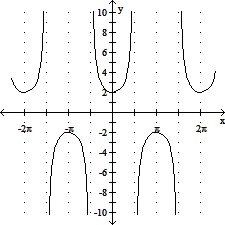
C. 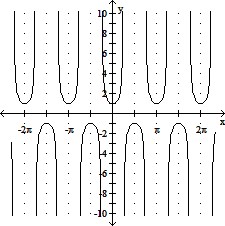
D. 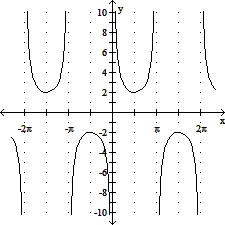
Answer: C
Mathematics
You might also like to view...
Use the data to make a histogram.The number of sweatshirts sold each day for 19 days is listed below. 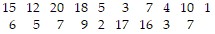
 0-56-1011-1516-20 Number of shirts sold per day
What will be an ideal response?
Mathematics
Multiply.
A. 25,780 B. 25,580 C. 25,690 D. 25,680
Mathematics
Graph the polar equation.r = 
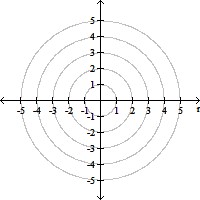
A. 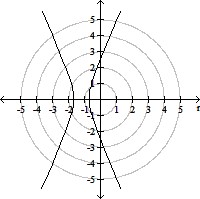
B. 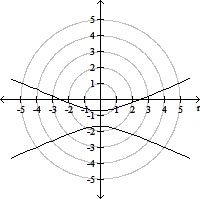
C. 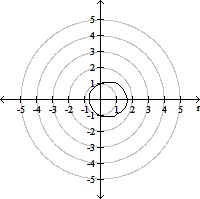
D. 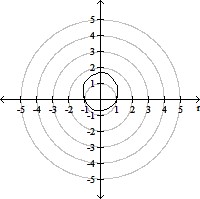
Mathematics
Find the indicated partial sum for the sequence.89, 61, 33, . . .; S10
A. 2150 B. 815 C. -815 D. -370
Mathematics