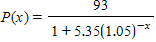
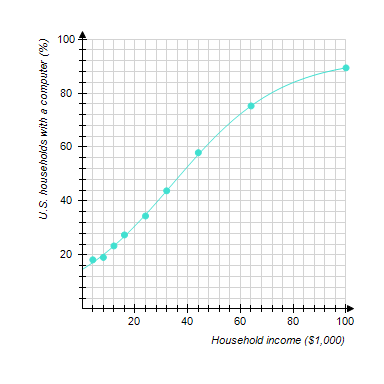
The following graph shows the actual percentage of U.S. households with a computer as a function of household income (the data points) and a logistic model of these data (the curve). The logistic model is
?
?
where x is the household income in thousands of dollars. For low incomes, the logistic model is approximately exponential. Which exponential model best approximates P(x) for small x? Round the coefficients to the nearest hundredth.
?
?
A. 
B. ?
C. ?
D. ?
E. ?
Answer: D
You might also like to view...
Simplify the expression.(-7x6yz8)2
A. -14x12yz16 B. -49x12y2z16 C. 49x12y2z16 D. 14x12yz16
Solve the problem.The Family Fine Arts Center charges $22 per adult and $14 per senior citizen for its performances. On a recent weekend evening when 507 people paid admission, the total receipts were $8098. How many who paid were senior citizens?
A. 215 senior citizens B. 125 senior citizens C. 382 senior citizens D. 292 senior citizens
Find the probability.If two 8-sided dice are rolled what is the probability that both numbers will be even?
A. 
B. 
C. 
D. 
Solve the equation.-15.4 = -2.2c
A. 2 B. -13.2 C. 13.2 D. 7