The bar graph shows the number of new residents in several towns during the years 1999 to 2001. Use the graph to answer the question. 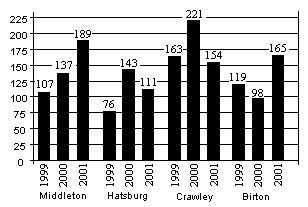 What was the total number of new residents in the four towns during the year 2000?
A. 619
B. 599
C. 567
D. 465
Answer: B
Mathematics
You might also like to view...
Find the derivative of y with respect to x.y = 5x3 sin-1 x
A.  + 15x2 sin-1 x
B.  + 15x2
C. 
D.  + 15x2 sin-1 x
Mathematics
Solve the problem.Tim and Judy mix two kinds of feed for pedigreed dogs. They wish to make 25 pounds of feed worth $0.25 per pound by mixing one kind worth $0.15 per pound with another worth $0.31 per pound. How many pounds of the cheaper kind should they use in the mix? Round your answer to the nearest pound, if necessary.
A. 16 pounds B. 9 pounds C. 11 pounds D. 21 pounds
Mathematics
Graph the system of inequalities.x2 + y2 ? 366x + 2y ? 12
A. 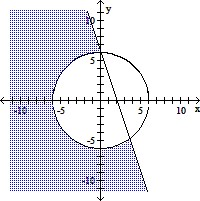
B. 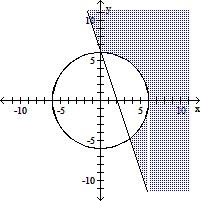
C. 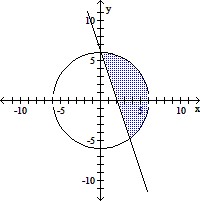
D. 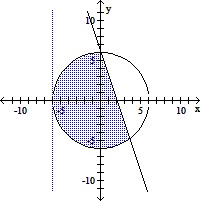
Mathematics
Find the equation of the axis of symmetry of the parabola.f(x) = (x + 1)2 - 5
A. y = 5 B. x = 5 C. x = 1 D. x = -1
Mathematics