Solve the problem.The following graph shows that more and more people in a certain country are moving from urban areas to the suburbs. In 2000, the percentage of the population living in urban areas was 71 and this percentage decreased by 2.4 each year, on average, in the period 2000-2010. In 2000, the percentage of the population living in the suburbs was 4 and this percentage increased by 2.4 each year, on average, in the period 2000-2010. Assuming this trend continues, estimate the year in which the percentage of the population living in urban areas will be equal to the percentage living in the suburbs. 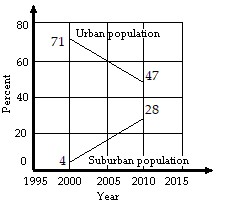
A. 2015
B. 2014
C. 2019
D. 2011
Answer: B
Mathematics
You might also like to view...
Decide whether the statement is true or false.At least one irrational number is not an integer.
A. True B. False
Mathematics
Express the percentage as a decimal.0.0078%
A. 0.0078 B. 0.078 C. 0.000078 D. 0.00078 E. 7.8
Mathematics
Evaluate.(23)log8 9
A. 9 B. 512 C. 27 D. 18
Mathematics
Solve the problem.Earth is represented on a map of the solar system so that its surface is a circle with the equation  A weather satellite circles 0.5 units above the Earth with the center of its circular orbit at the center of the Earth. Find the general form of the equation for the orbit of the satellite on this map.
A. x2 + y2 + 6x + 4y + 12.75 = 0 B. x2 + y2 + 6x + 4y - 3893.25 = 0 C. x2 + y2 - 6x - 4y - 3893.25 = 0 D. x2 + y2 + 6x + 4y - 48.75 = 0
Mathematics