Table 1.3 shows the hypothetical trade-off between different combinations of brushes and combs that might be produced in a year with the limited capacity for Country X, ceteris paribus.Table 1.3Production Possibilities for Brushes and CombsCombinationNumber of BrushesOpportunity Cost of Brushes in Terms of CombsNumber of CombsOpportunity Cost of Combs in Terms of BrushesJ0 4 K10 3 L17 2 M21 1 N23 0 Table 1.3Production Possibilities for Brushes and CombsCombinationNumber of combsOpportunity Cost(Foregone brushes)Number of brushesOpportunity Cost (Foregone combs)J4 0NAK3 10 L2 17 M1 21 N0NA23 On the basis of Table 1.3, what is the opportunity cost of producing at point M rather than point N?
A. 1 brush.
B. 21 combs.
C. 2 brushes.
D. 23 combs.
Answer: C
You might also like to view...
Kelly's Surf Shop orders 5,000 new surf boards at the beginning of the year but only sells 4,500 by the end of the year. How are the 500 unsold surfboards accounted for in Gross Domestic Product?
A) They will be included in the nondurable consumption category of GDP. B) They will be included in the residential investment category of GDP. C) They will be included in the government spending category of GDP. D) They will be included in the inventory investment category of GDP. E) They will be included in the durable consumption category of GDP.
A recession runs from the
A) peak of the business cycle to its trough. B) peak of the business cycle to a recovery. C) expansion of a business cycle to its peak. D) trough of a business cycle to its peak. E) trough of a business cycle to its expansion.
Explain the relationship between business cycles in different countries
What will be an ideal response?
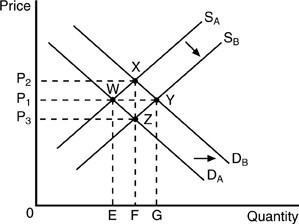 Refer to the above figure. Suppose that the supply curve shifts from SA to SB while the demand curve remains at DA. Which of the following is TRUE?
A. Only quantity demanded has decreased. B. Only quantity supplied has increased. C. Supply has increased. D. Supply has decreased.