Use a graphing calculator to plot the data and find the quadratic function of best fit.The number of housing starts in one beachside community remained fairly level until 1992 and then began to increase. The following data shows the number of housing starts since 1992 (x = 1). Use a graphing calculator to plot a scatter diagram. What is the quadratic function of best fit?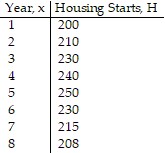
A. H(x) = -3.268x2 + 30.494x - 168.982
B. H(x) = 3.268x2 + 30.494x + 168.982
C. H(x) = -3.268x2 + 30.494x + 168.982
D. H(x) = -3.268x2 - 30.494x + 168.982
Answer: C
Mathematics
You might also like to view...
Determine whether the statement is true or false.Every natural number can be expressed as a sum of Fibonacci numbers, where no number is used more than once.
A. True B. False
Mathematics
Find the transpose of the matrix.
A. 
B. 
C. 
D. 
Mathematics
Solve the inequality. Graph your solution on a number line, and write your solution in interval notation. (3x + 4) >
  (6x - 5)
![]()
A. 
![]()
B. 
C. 
![]()
D. 
![]()
Mathematics
Find the slope of the line passing through the pair of points or state that the slope is undefined.(-8, -5), (2, 9)
A. 
B. 
C. 
D. 
Mathematics