Figure 29-1
?
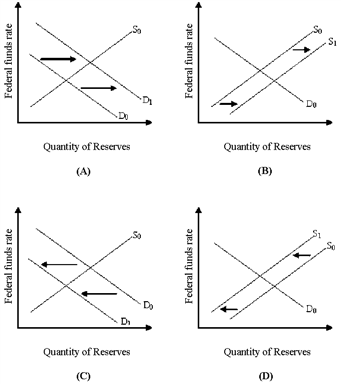
In Figure 29-1, which panel shows the effect of a Fed open-market sale on the interest rate?
A. Panel (A)
B. Panel (B)
C. Panel (C)
D. Panel (D)
Answer: D
You might also like to view...
In the figure above, the market for jackets ________ in long-run equilibrium, and there is ________ for new firms to enter
A) is; no incentive B) is; an incentive C) is not; an incentive D) is not; no incentive
The FE line is vertical because the level of output at full employment doesn't depend on the
A) real wage rate. B) level of employment. C) marginal product of labor. D) real interest rate.
What do Baack and Ray (1983) find in their survey of U.S. tariff history?
(a) Tariff rates in the U.S. were low. (b) Tariff cuts were associated with the fast-growing industries. (c) The highest tariff rates in the U.S. were associated with the fastest growing industries. (d) The U.S. was a world leader in free trade policy.
Assume that a perfectly competitive firm faces a fixed wage rate of $4 and a constant per-unit cost of capital of $2. If the marginal product of labor and capital are 16 and 6, respectively, then to maximize profits the firm should
A) use relatively more capital. B) use relatively less capital. C) increase all inputs proportionately. D) decrease all inputs proportionately.