Refer to the diagrams, in which AD 1 and AS 1 are the "before" curves and AD 2 and AS 2 are the "after" curves. Other things equal, a decline in productivity is depicted by:
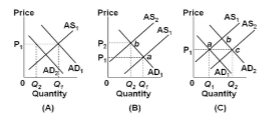
A. panel (A) only.
B. panel (B) only.
C. panel (C) only.
D. panels (B) and (C).
B. panel (B) only.
You might also like to view...
Elected government officials seem biased toward favoring
A) the national interest. B) the global interest. C) well organized, special interest groups. D) policies that are in the long-run interest of economists.
In a production process, all inputs are increased by 10%; but output increases less than 10%. This means that the firm experiences
A) decreasing returns to scale. B) constant returns to scale. C) increasing returns to scale. D) negative returns to scale.
Refer to the above figures. Which panel represents the expected relationship between tax revenue and the sales tax rate if dynamic tax analysis is used?
A) Panel 1 B) Panel 2 C) Panel 3 D) Panel 4
Resources employed to persuade government to redistribute income and wealth to special interests are unproductive
a. True b. False