This graph demonstrates the domestic demand and supply for a good, as well as a tariff and the world price for that good.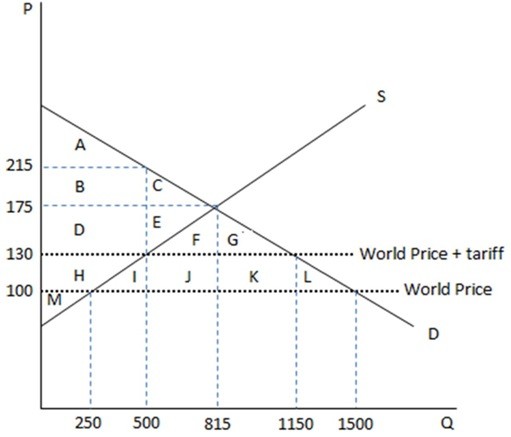 According to the graph shown, the area ABC represents consumer surplus in an economy with:
A. free trade.
B. a tariff being imposed on trade.
C. autarky.
D. None of these is true.
Answer: C
You might also like to view...
The total variable cost curve ________ because ________ as output increases
A) slopes upward; variable cost increases B) slopes upward; marginal cost increases C) slopes downward; variable cost increases D) slopes downward; marginal cost increases E) is horizontal; fixed cost does not change
The difference between bid (buying) rates and ask (selling) rates is called the
A) profit. B) arbitrage. C) spread. D) forward transaction.
David increases the number of companies in which he holds stocks
a. This reduces risk's standard deviation and firm-specific risk. b. This reduces risk's standard deviation and market risk. c. This raises market risk, but lowers firm-specific risk. What happens to overall risk is unclear. d. This raises firm-specific risk, but lowers market risk. What happens to overall risk is unclear.
What did Harvard economist Edward Chamberlain say about the observation that a monopolistically competitive firm's average cost of production exceeds its minimum average total cost?
A. Chamberlain argued that this belief is incorrect. In his view, monopolistically competitive firms do not produce at a cost above their minimum average total costs. B. In Chamberlain's view, this is evidence that monopolistic competition uses society's resources inefficiently and in a fashion that merits government intervention. C. Chamberlain argued that these higher costs represent the wastefulness of this market structure. D. According to Chamberlain, this cost difference represents the value consumers place on variety and having more choice.