Refer to the information provided in Figure 2.5 below to answer the question(s) that follow.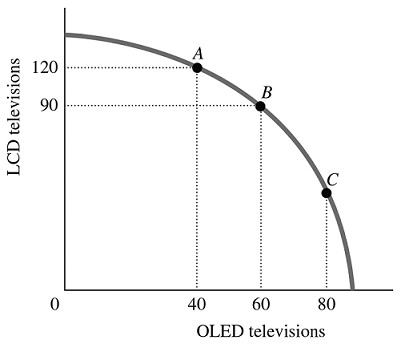 Figure 2.5Refer to Figure 2.5. For this economy to move from Point C to Point B, ________ additional LCD TVs could be produced when the production of OLED TVs is reduced by 20.
A. exactly 30
B. exactly 60
C. fewer than 30
D. more than 30
Answer: C
You might also like to view...
One reason the total sum of the income categories does not equal GDP is that
A) taxes are generally larger than subsidies and the depreciation of capital is negligible. B) GDP values goods and services at retail prices and the income approach values them at wholesale cost. C) people do not spend all their income, so the value of consumption expenditure is less than the value of wages. D) GDP does not include depreciation, which is part of the income categories. E) GDP values goods and services at market prices and the income approach values them at factor cost.
A.W. Phillips' study of unemployment and inflation in the United Kingdom specifically looked at the empirical relationship between the unemployment rate and the
A) rate of change in prices. B) rate of change in nominal wages. C) rate of change in real wages. D) level of nominal wages.
The above figure shows the market for rice in Japan. SDomestic represents the domestic supply curve, and Sworld represents the world supply curve. If imported rice is banned, the loss in social welfare is
A) a + b + c + d + i + j. B) a. C) c + e. D) a + b + c + d.
Suppose that demand for tablets increases, and simultaneously, the supply of tablets increases. Which of the following would you conclude definitely will occur in the market for tablets?
A) The market clearing price will rise. B) The market clearing price will fall. C) The equilibrium quantity will rise. D) The equilibrium quantity will fall.