Assume the market in the graph shown with demand D and supply S1 is in equilibrium at a quantity of 5 units. Total surplus is:
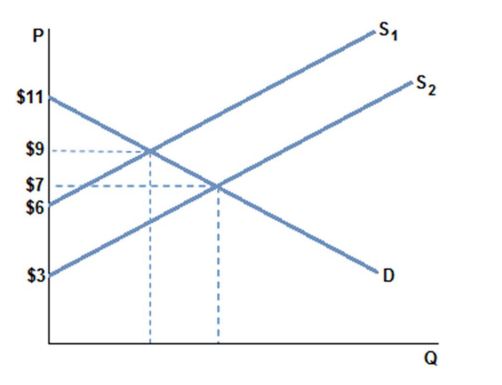
A. $5.
B. $15.
C. $12.50.
D. $60.
C. $12.50.
You might also like to view...
When a firm’s AC eventually starts to rise, it is often because
A. executive salaries rise sharply as output rises. B. the ability to manage larger and larger levels of output results in much higher administrative costs. C. marginal cost increases rapidly at higher output levels. D. firm output has started to decline.
According to New Keynesians, a reduction in which of the following will tend to cause the inflation rate to decrease?
A) anticipated future inflation B) firms' average inflation adjusted per-unit costs of production C) an unexpected reduction in aggregate demand D) all of the above
The pure monopolist's demand curve is relatively elastic:
A. in the price range where total revenue is declining. B. at all points where the demand curve lies above the horizontal axis. C. in the price range where marginal revenue is negative. D. in the price range where marginal revenue is positive.
The table shows the aggregate demand and aggregate supply schedule for a hypothetical economy.Real Domestic Output Demanded (in Billions)Price Level (Index Value)Real Domestic Output Supplied (in Billions)$3,000350$9,0004,0003008,0005,0002507,0006,0002006,0007,0001505,0008,0001004,000Refer to the above table. If the quantity of real domestic output demanded increased by $2000 at each price level, the new equilibrium price level and quantity of real domestic output would be:
A. 350 and $8000. B. 300 and $8000. C. 200 and $6000. D. 250 and $7000.