First, create a scatter plot for the data in the table. Then, use the shape of the scatter plot given to determine if the data are best modeled by a linear function, an exponential function, a logarithmic function, or a quadratic function.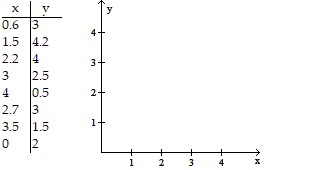
A. 
linear function
B. 
logarithmic function
C. 
exponential function
D. 
quadratic function
Answer: D
Mathematics
You might also like to view...
Determine if the item described is designed in accordance with the golden ratio.A formal garden has a width of 28.90 meters and a length of 53.75 meters.
A. Yes B. No
Mathematics
Solve the equation or inequality. = -6
= -6
A. {6}
B. 
C. ?
D. {-6}
Mathematics
Find the following using a calculator. Round to four decimal places.ln 0
A. -0.6697 B. -0.7054 C. Does not exist D. -0.6808
Mathematics
Graph the parabola and label the vertex. Find the y-intercept.y = -2 2 - 2
2 - 2
A. vertex  , y-intercept (0, -114.5)
B. vertex  , y-intercept (0, -114.5)
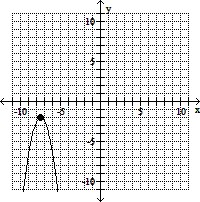
C. vertex  , y-intercept (0, -114.5)
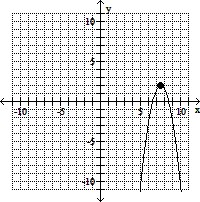
D. vertex  , y-intercept (0, 114.5)
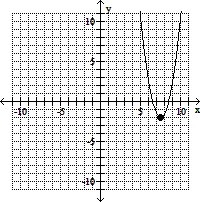
Mathematics