Refer to the diagram for a specific economy. The curve on this graph is known as a:
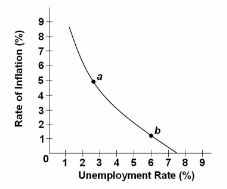
A. Laffer Curve.
B. Phillips Curve.
C. labor demand curve.
D. production possibilities curve.
B. Phillips Curve.
You might also like to view...
Real GDP per person averaged $150 a year (in 2009 dollars) from 1,000,000 BC until 1620. Then in ________ real GDP began to increase without limit and by 1850 had risen to twice its 1650 level because ________
A) 1750; of the Industrial Revolution B) 1776; United States was founded C) 1750; Columbus arrived in the Americas D) 1650; the Pilgrims arrived in the Americas E) 1650; of the Industrial Revolution
When the unemployment rate rises, college enrollment increases because workers seek to expand training. This is an example of:
A. correlation and causation. B. a negative correlation. C. normative economics. D. macroeconomics.
The average variable cost curve is a mirror image of the:
A. average product curve. B. total product curve. C. marginal product curve. D. marginal cost curve.
Once active discrimination ends, it:
A. is quickly forgotten, and efficiency is reached. B. no longer affects people or markets. C. can have long-lasting effects on people and markets. D. None of these is true.