Graph the function f(x) over the given interval. Partition the interval into 4 subintervals of equal length. Then add to your sketch the rectangles associated with the Riemann sum  , using the indicated point in the kth subinterval for ck.f(x) = cos x + 1, [0, 2?], right-hand endpoint
A. 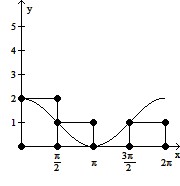
B. 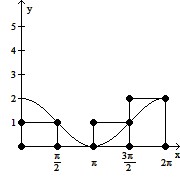
C. 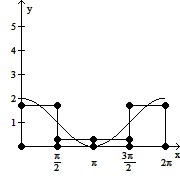
D. 
Answer: B
Mathematics
You might also like to view...
Determine the ratio and write it in lowest terms.5 hours to 40 minutes
A. 
B. 
C. 
D. 
Mathematics
Write the decimal as a fraction in lowest terms.0.001
A. 
B. 
C. 
D. 
Mathematics
Find the mass of the wire that lies along the curve r and has density ?.C1: r(t) = (6 cos t)i + (6 sin t)j, 0 ? t ?  ;C2: r(t) = 6j + tk, 0 ? t ? 1; ? = 7t5
A.  ?5 units
B. 
 units
units
C.  ?5 units
D. 
 units
units
Mathematics
Find the extreme values of the function and where they occur.f(x) = 
A. Absolute maximum value is 0 at x = 0.
B. Absolute minimum value is 0 at x = 0.
C. Absolute minimum value is 0 at x = 1. Absolute maximum value is 0 at x = -1.
D. Absolute minimum value is -  at x = -1. Absolute maximum value is
  at x = 1.
Mathematics