How does the leftward shift of the supply curve in graph 2 affect the individual firm shown in graph 1?
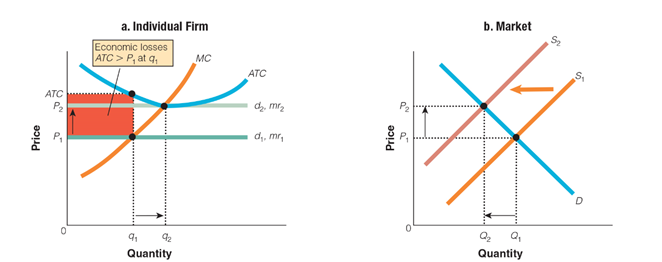
a. It causes the firm’s quantity of sales to decrease.
b. It causes the firm’s product price to increase.
c. It causes the firm to dip below its average total cost.
d. It causes the demand for the firm’s products to decrease.
b. It causes the firm’s product price to increase.
You might also like to view...
Answer the following statement(s) true (T) or false (F)
1. Firms are so diverse in size and organization that it is not possible to make any general statements about their behavior. 2. Economists attempt to understand firm behavior by making the generalization that firms act to maximize growth. 3. In order to maximize profits, firms should produce to the point where marginal revenue is equal to marginal cost. 4. If the total benefits received from drug enforcement exceed its total costs, then the government should expand its drug enforcement activity. 5. Total cost and marginal cost can both be plotted on the same graph since both include a measure of quantity.
The United States economy ______________ operates on its production possibility curve.
A. Always B. Sometimes C. Never
All of the following statements are true except
A. Until 1971 the United States had run a trade surplus virtually every year of the 20th century. B. The U.S. ran relatively small trade deficits through most of the 19th century. C. The U.S. was the only industrial power to raise tariffs during the 1930s. D. World trade in the 1930s dwindled to a fraction of what it had been in the 1920s.
Which one of these periods had the highest rate of inflation?
A. 1945-1948. B. 1957-1960. C. 1961-1964. D. 1969-1972. E. 1984-1986.