The graph of an exponential function is given. Match the graph to one of the following functions.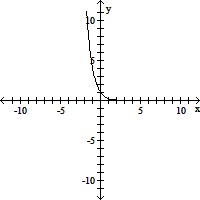
A. f(x) = - 4-x
B. f(x) = 4-x
C. f(x) = - 4x
D. f(x) = 4x
Answer: B
You might also like to view...
Find the domain and range of the inverse of the given function.f(x) = x3 - 4
A. Domain and range: all real numbers B. Domain: [0, ?); range: [0, ?) C. Domain: all real numbers; range: [-4, ?) D. Domain: [-4, ?); range: all real numbers
Graph the region described by the inequality.y ? 2 
A. 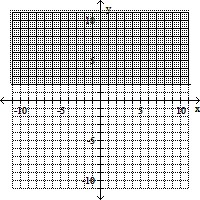
B. 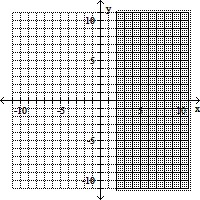
C. 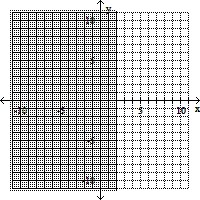
D. 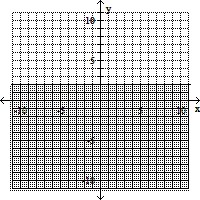
Provide an appropriate response.The dot plot shows the number of tornadoes each year in a certain county during the period 1948 to 2004. Describe the range of the data, the "typical" value, and the most common number of tornadoes. Are there any outliers? 
A. The number of tornadoes per year ranges from 0 to 7. Most values lie between 4 and 5 with the most common number of tornadoes being 5. The value 7 is an outlier. B. The number of tornadoes per year ranges from 0 to 7. Most values lie between 4 and 6 with the most common number of tornadoes being 5. There are no outliers. C. The number of tornadoes per year ranges from 1 to 7. Most values lie between 4 and 6 with the most common number of tornadoes being 5. There are no outliers. D. The number of tornadoes per year ranges from 0 to 7. Most values lie between 4 and 6 with the most common number of tornadoes being 5. The values 0 and 7 are outliers.
Provide an appropriate response.If you pay $5,500 for a simple interest note that will be worth $6,000 in 21 months, what annual simple interest rate will you earn? (Compute the answer to one decimal place.)
Fill in the blank(s) with the appropriate word(s).