Identify the curve.
?

?
A. point
B. hyperbola
C. parabola
D. circle
E. line
Answer: D
You might also like to view...
Graph the system of inequalities.2x + 3y ? 6x - y ? 3
A. 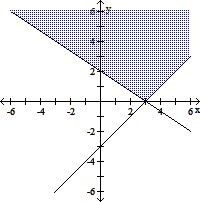
B. 
C. 
D. 
Solve the problem.A town's average monthly temperature data is represented in the table below: 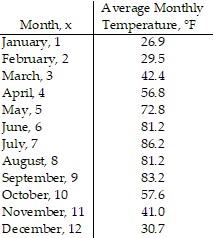 Find a sinusoidal function of the form
 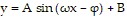 that fits the data.
A. y = 86.2 sin  + 26.9
B. y = 26.9 sin  + 86.2
C. y = 56.55 sin  + 29.65
D. y = 29.65 sin  + 56.55
Write the expression in the standard form a + bi.(2 + 6i)(2 - 6i)
A. 4 - 36i B. 4 - 36i2 C. -32 D. 40
Solve the problem.In 1971,  and
and  had the same population. The population of
  continued to increase steadily, while the rate of population growth of
  (although initially less than that of
  ) eventually overtook the growth rate of City #2. The
populations of two cities are modeled by the following equations:  :
: 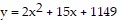 ;
;  :
:  , where
  corresponds to the year 1971. In what year after 1971 did the cities have the same population?
A. 1976
B. 1975
C. 1974
D. 1977