Solve.A survey report project in France estimated that for the years 2000-2005, the total number of bakeries in a particular region would grow according to the linear equation  where x is the number of years after 2000. Graph the equation and use the graph to predict the total number of bakeries in 2006.
A. 300 bakeries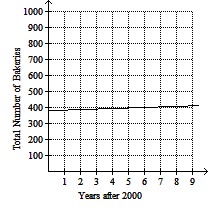
B. 400 bakeries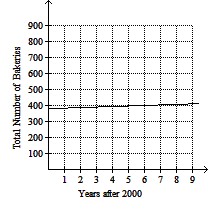
C. 382 bakeries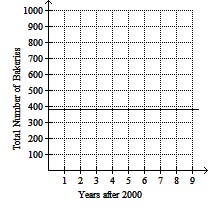
D. 360 bakeries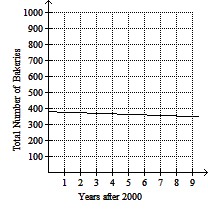
Answer: B
Mathematics
You might also like to view...
Use a half-angle formula to find the exact value of the expression.cos 
A. - 

B. 

C. 

D. - 

Mathematics
Multiply.-8(-3)(4)
A. 96 B. 196 C. -96 D. 86
Mathematics
Graph the system of inequalities.x2 + y2 ? 4x + y > 1
A. 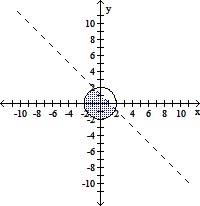
B. 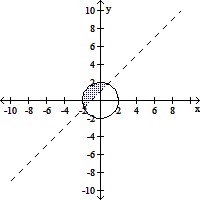
C. 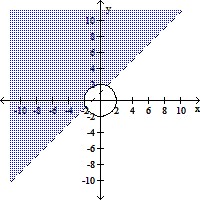
D. 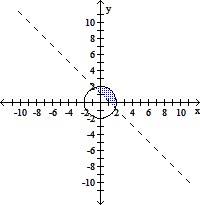
Mathematics
Which method should be used to solve the system? Explain your answer, including a description of the first step.x2 - y2 = 367x + y = -7
What will be an ideal response?
Mathematics