Solve.The table shows an area's population (in millions) every 10 years from 1965 to 2005. What was the difference in population from 1975 to 2005? 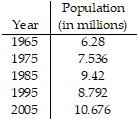
A. 4.396 million
B. 3.14 million
C. 36.424 million
D. 1.256 million
Answer: B
Mathematics
You might also like to view...
Add.
A. 58 B. 85 C. 67 D. 94
Mathematics
Graph the parabola.x = 3y2 - 2y + 6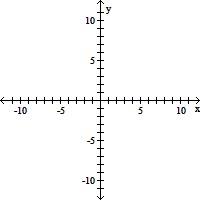
A. 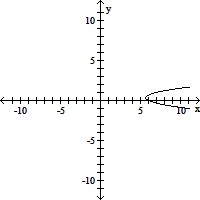
B. 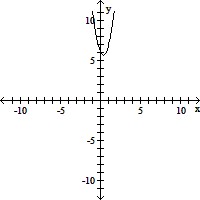
C. 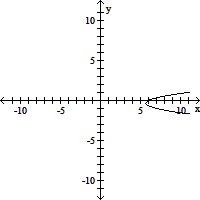
D. 
Mathematics
Write the standard form of the equation of the circle described.Center (0, 0), r = 
A. x2 + y2 = 121
B. x2 + y2 = 
C. x2 + y2 = 
D. x2 + y2 = 11
Mathematics
Multiply.× 
A. 219.68 B. 219.57 C. 60.2 D. 220.67
Mathematics