Refer to the information provided in Figure 24.1 below to answer the question(s) that follow.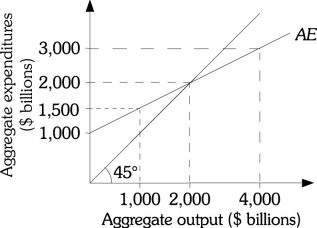 Figure 24.1Refer to Figure 24.1. At equilibrium, $1,000 billion represents
A. the part of consumption that is not dependent on income.
B. the part of consumption that is dependent on income.
C. equilibrium income.
D. Both A and B are correct.
Answer: D
You might also like to view...
Why must a good economic theory use abstraction?
a. It makes theories more complicated and thus more accurate. b. It summarizes, thereby making theories easy for lay people to understand. c. The world is too complex to analyze without it. d. Economics is too unpredictable to analyze without it.
Which of the following accurately explains a difference between the short-run aggregate supply (SRAS) curve and the long-run aggregate supply (LRAS) curve?
a. The LRAS curve reflects constant input prices with adjustable output prices, whereas the SRAS curve reflects adjustable input and output prices. b. The LRAS curve reflects constant output prices with adjustable input prices, whereas the SRAS curve reflect constant output prices. c. The SRAS curve reflects constant input prices with adjustable output prices, whereas the LRAS curve reflects adjustable input and output prices. d. The SRAS curve reflects constant output prices with adjustable input prices, whereas the LRAS curve reflects constant input and output prices.
If the quantity supplied stays the same no matter what the price is, then supply is
A) perfectly inelastic. B) perfectly elastic. C) unit elastic. D) undefined.
Let Edt= -2. This implies that the demand for movie tickets is
A. elastic, because a 1 percent change in Pt changes Qdt by 2 percent. B. inelastic, because a 1 percent change in Pt changes Qdt by 2 units. C. elastic, because a 1 percent change in Pt changes Qdt by 1 percent. D. inelastic, because a 1 percent change in Pt changes Qdt by 1 percent.