Provide an appropriate response.Explain in your own words the difference between a bar graph and a histogram. Give an example of data for which you might use a histogram and an example of data for which you might use a bar graph.
What will be an ideal response?
Answers will vary. Possible answer: A histogram is used for quantitative data, has a continuous numerical scale on the horizontal axis, and there are no gaps between the bars. A bar graph is used to represent qualitative data. It does not have a continuous numerical scale on the horizontal axis, but names of the different categories. There are gaps between the bars. Examples of data will vary.
You might also like to view...
Find V3 with respect to point A.

a. +40 V
b. -40 V
c. +30 V
d. -30 V
e. +15 V
Provide an appropriate response.Convert  radians to degrees.
Fill in the blank(s) with the appropriate word(s).
Solve the problem.Penrose tiles are formed from a rhombus WXYZ with sides of length 1 and interior angles 72° and 108°. (Refer to the illustration.) A point O is chosen on the diagonal 1 unit from Y. Line segments OX and OZ are drawn to the other vertices. The two resulting tiles are called a kite (figure OXYZ) and a dart (figure OXWZ). Find the area of the kite tile and the dart tile, correct to the nearest 0.01. 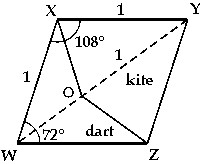
What will be an ideal response?
Find the value of the limit for the sequence given. Select the correct answer.
 multiple choice.png)