Exhibit 4-8 Demand and supply curves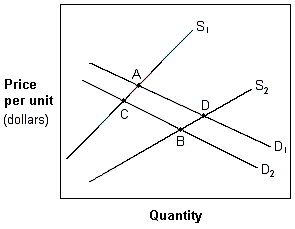
In Exhibit 4-8, a movement from A to B is best explained by:
A. an increase in income and in the number of suppliers.
B. an increase in the price of other goods.
C. an increase in the population.
D. a decrease in income if X is a normal good and an improvement in the technology used to produce the good.
Answer: D
You might also like to view...
If the United States has a $300 billion net capital inflow, then there must be a:
A. trade surplus of $300 billion. B. trade surplus of $600 billion. C. net capital outflow of $300 billion. D. trade deficit of $300 billion.
In the economy of Talikastan in 2015, consumption was $600, exports were $300, GDP was $1300, government purchases were $250, and investment was $300 . What were Talikastan's imports in 2015?
a. -$150 b. -$200 c. $200 d. $150
Which factor will not cause an increase in the supply of good X?
A. an improvement in the technology used to produce good X B. an increase in the price of inputs used to produce good X C. a decrease in the price of labor used to produce good X D. an increase in the number of firms that sell good X
Action to reverse the effect of official intervention on the domestic money supply is called
A. sterilization. B. a crawling peg. C. the gold standard. D. a parallel market.