Exhibit 5-8 Supply and demand curves for good X
?
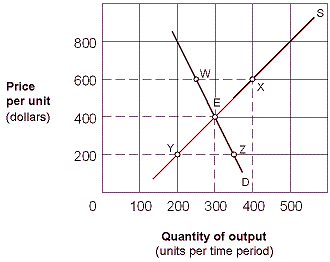
In Exhibit 5-8, the price elasticity of supply for good X between points E and X is:
A. 7/5 = 1.40.
B. 1/5 = 0.20.
C. 5/7 = 0.71.
D. 1.
Answer: C
You might also like to view...
When the U.S. government runs a deficit, the savings in the market for loanable funds shifts:
A. left, increasing interest rates and decreasing domestic investment and NCO. B. left, decreasing interest rates and increasing domestic investment and NCO. C. right, decreasing interest rates and increasing domestic investment and NCO. D. right, increasing interest rates, and increasing domestic investment and NCO.
Human capital is increased when a firm makes investments that raise workers' productivity.
A. True B. False C. Uncertain
Census data indicate that, as of 2014, the top fifth of all households receive about ________ times as much income as the bottom fifth.
A. sixteen B. twelve C. eight D. three
Resources are limited in both wealthy and poor societies.
Answer the following statement true (T) or false (F)