This diagram shows Earth's atmospheric carbon dioxide concentration over the past few decades. What is the significance of the up and down wiggles?
A) They show seasonal variations in the concentration.
B) They show that the rise in carbon dioxide concentration is caused by human activity.
C) They show that the carbon dioxide concentration can vary randomly and by large amounts.
D) They show that there is a lot of noise in data that attempt to measure the carbon dioxide concentration.
A) They show seasonal variations in the concentration.
You might also like to view...
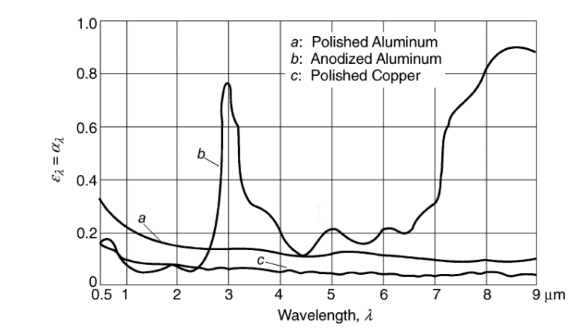
Compute the average emittance of anodized aluminum at 100°C and 650°C from the spectral curve. Assume ?? = 0.8 for ? > 9 ?m
GIVEN
The spectral curve for anodized aluminum
FIND
The average emittance (?) at (a) 100°C = 373 K, and, (b) 650°C = 923 K
SKETCH
PROPERTIES AND CONSTANTS
the Stephan-Boltzmann constant (?) = 5.67 10–8 W/(m2 K4)
________ provides experimental evidence that the Universe is expanding.
A. Dark matter B. Hubble's law C. The Big Bang model D. The cosmological constant
Interstellar dust consists mostly of
A) ozone "smog." B) microscopic particles of carbon and silicon. C) hydrogen and helium atoms. D) tiny grains of water ice. E) the same tiny particles found in household dust.
When a 60-W lightbulb is operating on a 120-V household line, what current does it draw?
A) 0.5 A B) 120 J/C C) 2.0 A D) 1.414 A E) 40 J/C